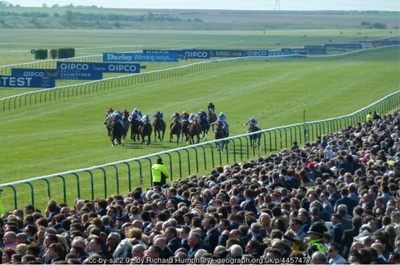
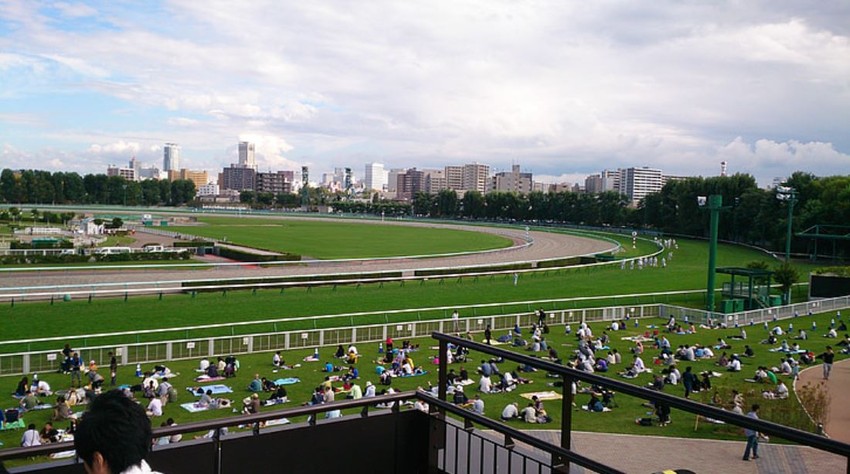
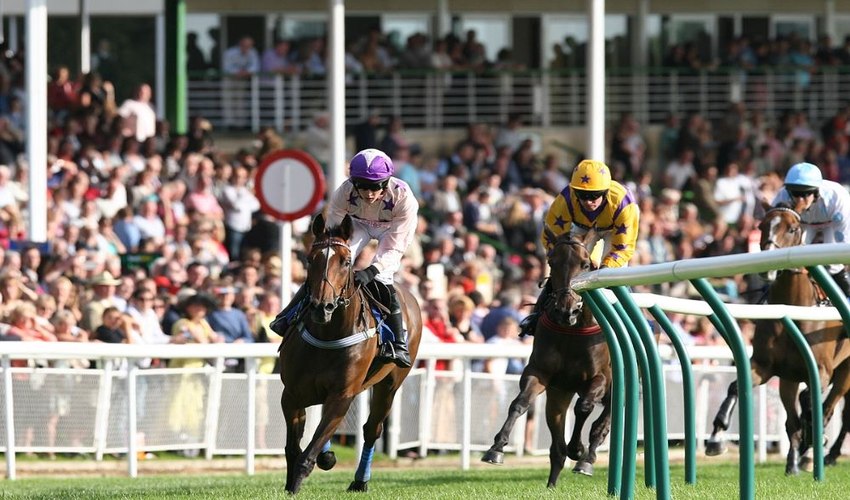
 It’s no secret that British horse racing isn’t exactly at its peak in terms of attendance figures.
Racegoers have been slowly but surely dropping off for a long time now, but then COVID put a spanner in the works, first by cancelling everything, and then by spiking attendances as people flooded back to the racecourse desperate for something to do having been in lockdown for so long.
That was a temporary boom, however, as normality returned, and then a cost of living crisis came along and left people with less expendable income than usual, drawing down numbers again.
This has made it difficult to create a clear picture of where attendances are going, because they have been so heavily impacted by external forces.
There are statistics we can look at though, there are averages we can study from one year to the next and try to draw a conclusion that is at least based in fact.
We get a lot of doom and gloom news chronicling the downfall of what was once the nation’s favourite sport, but what do that stats tell us? What do the numbers say?
Horse Racing Attendances on the Decline?

Let’s look at the total number of racegoers attending meetings over the past decade or so. We will exclude 2020 and 2021 though, because the lockdowns make the numbers highly unusual for these years.
You can see from the table below, that after peaking in 2015, attendance numbers have been slipping ever since:
| Year | Attendance |
|---|---|
| 2012 | 5,583,215 |
| 2013 | 5,685,809 |
| 2014 | 5,820,836 |
| 2015 | 6,128,050 |
| 2016 | 5,987,167 |
| 2017 | 5,953,749 |
| 2018 | 5,772,768 |
| 2019 | 5,624,994 |
| 2022 | 4,838,401 |
The numbers dropped off by 100,000+ per year other than between 2016 and 2017 when it was around 33,000, and then between 2019 and 2022 they bombed by 786,593 – over three quarters of a million fewer attendees.
This shows that even though numbers had been gradually falling for the 5 years prior to the 2020 pandemic, they never picked up to previous levels after things went back to normal.
In fact, 2022 was the first year for 25+ years (excluding 2020/2021) that attendance figures came in at under 5 million.
Average Attendance Per Race

When we take the overall number of racecourse attendees and average it out over the number of meetings held each year, we will obviously see a similar pattern.
But the data recorded by the British Horse Racing Authority (BHA) can tell us something else too; the disparity between attendances at flat meetings and jumps meetings.
Interestingly, the average attendance at flat meetings used to be markedly different to that of jumps racing, but the two disciplines now sit pretty much equally.
If we go back to 2003, the average attendance at flat meetings peaked at 5,348, almost 25% higher than jumps at 4,287, although the widest gap between the two was 31.44% in 2001.
Twenty years later in 2022 though, that gap has shrunk so much that it has actually crossed over, and jumps racing was better attended than flat racing by almost 1%, with average numbers per meeting standing at 3,350 for jumps and 3,319 for flat.
The trouble with averages in this respect though, is that they don’t give much in the way of reasoning.
With 1,446 meetings taking place in the UK in 2022, a number that doesn’t change by much from one year to the next, there are bound to be some that are very quiet and some that are packed.
The racing calendar obviously dictates attendances to a point, especially when you consider the major meetings each year and what kind of races they are.
All racecourses must submit attendance figures for racegoers and on course bookies at each fixture, to the Horserace Betting Levy Board. These are the guys who collect and distribute the levy paid by bookmakers, in order to improve the sport.
These attendance figures give us a month-by-month breakdown of attendances at jumps, flat, and mixed meetings each year, so we can see the busiest and quietest times, as well as any particular big meetings.
Here is the jumps and flat data for 2022:
| Month | Flat Attendance | Jumps Attendance |
|---|---|---|
| Jan | 21,415 | 132,172 |
| Feb | 20,305 | 115,243 |
| Mar | 26,748 | 402,798 |
| Apr | 193,949 | 291,729 |
| May | 334,934 | 108,025 |
| Jun | 691,860 | 108,759 |
| Jul | 679,079 | 79,030 |
| Aug | 514,633 | 60,130 |
| Sep | 244,778 | 42,186 |
| Oct | 165,415 | 142,957 |
| Nov | 27,727 | 207,064 |
| Dec | 26,571 | 194,639 |
Months like June and July are obviously extremely busy for flat racing because of the likes of Royal Ascot, the Epsom Derby, and Glorious Goodwood when it lands in July as it did in 2022; whereas March and April obviously have Cheltenham Festival and the Grand National, so this boosts jump racing in those months.
Any big meeting will boost numbers though; what is more telling is how big the drop off is during months when one type of racing has no major meetings.
Using March as an example, there were just 26,748 racegoers at flat races during that month. We know that there were 1,446 meetings in 2022, so if we divide that by 12 (months of the year) we get:
- 1446 ÷ 12 = 120.5
Let’s call it 120 meetings per month on average.
However, there are usually more flat meetings than jump meetings staged each year, 889 flat vs 557 jumps in 2022, which means that roughly 61% of all meetings were flat meetings.
If we round that down to 60% for ease, and split that 120 meeting average 60/40, we get 72 meetings on the flat, and 48 over jumps.
Ok, so we can now use this figure to work out the average attendance for flat meetings in a quiet month like March, 2022.
- 72 (meetings) ÷ 26,748 (racegoers in March) = 371.5
So your average flat meeting in March had just 371 racegoers in attendance.
Chester is the smallest racecourse in the UK, and has a capacity of around 2,000 – some of the biggest racecourses in the country hold tens of thousands – imagine how empty it would feel with fewer than 400 people milling about.
Optimistic About Attendance in the Future

Despite how things look, there are reasons to be optimistic about the future, and many in the racing industry are.
As we said at the beginning of the article, unexpected scenarios like covid, a cost-of-living crisis, some freak weather, and even the death of Her Majesty the Queen, all either put racing on hold or kept people away from the courses.
Once we have had a run of 3 or 4 years where nothing so eventful happens, we will be able to see the true lay of the land.
At the start of 2023, the chief executive of the Racecourse Association, David Armstrong, said of the decline in attendance:
“I don’t think it’s a long-term problem, there are plenty of green shoots and we’re working hard to make racing relevant for a wider customer group.”
Meanwhile, the CEO of the Arena Racing Company which actually owns 16 of the courses we have been talking about, said:
“Yes, there are major challenges, but I don’t see it as a symptom of terminal decline. It’s actually an opportunity for racecourses to look afresh at product and value.”
The biggest meetings on the calendar all continue to do good business, and although your average meeting may be struggling for punters at the track, we have hit peaks and troughs before, even in recent history.
It’s in no doubt that racing has been going through a hard time, but it has come through hard times before, and we like to think that it will again.
