 For a horse race to be entertaining, and for it to hold any value whatsoever from a betting perspective, it needs to have a decent number of runners.
We wouldn’t want all races to be as busy as The Grand National, because that would make the whole industry more akin to playing the lottery than real betting, but equally, a field of 4 runners is boring to watch and easier to predict, meaning odds hold less value in most cases.
For the majority of races then, the key to getting things right is balance, but ideally you would have at least 8 horses taking part.
This is because, as well as being more entertaining to watch and more difficult for bookies to predict, there would be 3 places paid out instead of two, which is more favourable for place betting.
This is the case for races of between 8 and 15 runners, so we can consider 8 or more runners to be the optimal range for the majority of races.
The British Horse Racing Authority (BHA) has kept data on this sort of thing since 1995, so we can see how many races have 8 or more runners, and how often this sweet spot is hit.
Spoilers: it’s not nearly as often as bettors would like.
The Number of Races With More Than 8 Runners Has Fallen
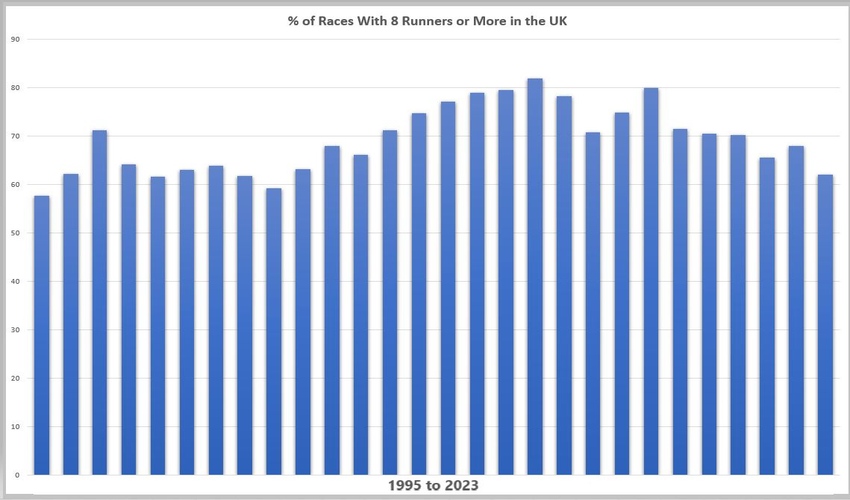
I will start this section by saying that signs of improvement have been mildly encouraging, but nevertheless, the number of horse races with more than 8 runners has declined since the BHA first started keeping records in 1995.
Back in the early 2000s it was common to see as many as 70%-80% of all races featuring at least 8 horses, but from 2006 to 2014 there was a dramatic decline all the way down to 59%, which is close to an all-time low.
Here you can see the average percentage of races that contained 8 runners or more from 1995 to 2023:
| Year | Average |
|---|---|
| 2023 | 62.47% |
| 2022 | 57.69% |
| 2021 | 62.24% |
| 2020 | 71.26% |
| 2019 | 64.08% |
| 2018 | 61.58% |
| 2017 | 62.98% |
| 2016 | 63.86% |
| 2015 | 61.74% |
| 2014 | 59.19% |
| 2013 | 63.14% |
| 2012 | 67.89% |
| 2011 | 66.14% |
| 2010 | 71.23% |
| 2009 | 74.77% |
| 2008 | 77.09% |
| 2007 | 78.98% |
| 2006 | 79.47% |
| 2005 | 81.94% |
| 2004 | 78.28% |
| 2003 | 70.74% |
| 2002 | 74.81% |
| 2001 | 79.97% |
| 2000 | 71.54% |
| 1999 | 70.54% |
| 1998 | 70.16% |
| 1997 | 65.6% |
| 1996 | 68.01% |
| 1995 | 62.06% |
You will notice that in the earlier years there was a bumpy but nevertheless considerable rise in the numbers, before the number of races with more than 8 runners fell off a cliff.
As I discussed in the sister article to this one, How Often do Less Than 6 Horses Run in a Race, this decline was (and is) down to money mostly, but contributing factors are a drop in the number of spectators at racecourses, incompatible weather conditions, and an overcrowded race schedule spreading runners too thin.
The pitiful amount of prize money is the biggest problem though, with even the UKs most valuable races paling in comparison to those in the USA, Australia, Hong Kong, and the UAE.
The racing industry has been moving to address this, and we can see a glimmer of hope since COVID as the number of races with 8 or more runners has begun to climb again, and that goes for flat and jump racing, so it is an industry wide improvement.
Although this is only very recent, I think it is encouraging because, if we look before the covid pandemic in 2020, the numbers were already steadily improving.
The huge spike in 2020 where we went from 64.08% to 71.26% is a distortion caused by the lack of races available to run during the year due to lockdown. Everyone piled their horses into the races that were going ahead because there were fewer to choose from, causing an unnatural boost in the number of runners in each race.
The recovery period after this wasn’t pretty, in fact, 2022 saw a record low of just 57.69% of all races containing 8 runners or more – a drop of over 19% from that 2020 figure – but we are hopefully over the worst of it now.
Jump vs Flat Racing
 I will briefly touch on this, but there is not a great deal to say on the matter.
So far I have been looking at totals, so all races in all disciplines put together, but if we pull those totals apart we can sometimes glean more insight into what is happening and why.
It’s all fairly straightforward in this case though.
Flat racing tends to have larger fields than jump racing on the whole anyway, and when we look at the two types of racing compared with the number of races containing 8 or more runners, we see predictable results.
There has been only a single year in which jump races have had more races with 8+ runners than flat racing, and that was in 2008, with a very small difference of 78.31% to 76.42%. Let’s investigate what happened either side of this unique year.
From 1995 to 2007 there was an average gap of 11.84% between the two disciplines, and between 2009 and 2023 the average stood at 10.26%. So the gap between the two styles of racing has closed slightly since the 2008 crossover, but look at this:
| Type | 1995-2007 avg | 2009-2023 avg | % Drop |
|---|---|---|---|
| Jumps | 66.11% | 57.07% | 9.04% |
| Flat | 78.16% | 68.57% | 9.59% |
Although it is only by a very small amount, the number of flat races with 8 or more runners has actually reduced more than jumps, on average, since that crossover point in 2008.
It’s a small change, but it’s there.
All Weather Tracks
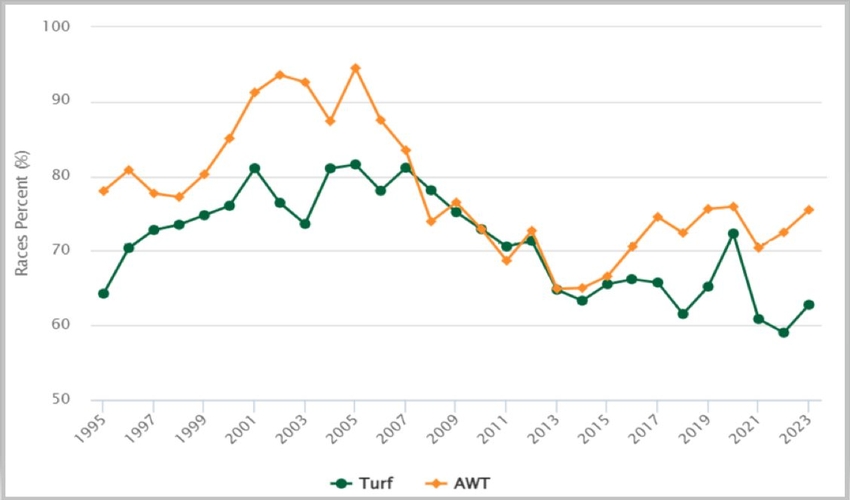
One telling stat shown by the BHA data, is that All Weather Tracks have a higher percentage of races with 8 runners or more than turf tracks.
It would be very hard to argue that this was to do with anything other than ground conditions.
The whole purpose of all weather tracks is to allow races to go ahead even in more challenging conditions, and they seem to be achieving this, or at the very least enabling more horses to run in the races.
This will be because trainers are happier to declare their horses at courses with all weather tracks, since they are less likely to come up against any nasty surprises. There will also be fewer non-runners at all weather tracks for the same reason, which will again help to keep the number of runners higher.
The chart above shows that all weather tracks have had a greater number of races with more than 8 runners than turf tracks in almost every year since 1995, and even in the odd year when that hasn’t been the case, it’s been very close.
The busiest year for all weather tracks was in 2002, with 93.58% of races featuring at least 8 horses, and the quietest year was 2013 with 64.91% – but even then it was slightly more than turf tracks could manage.
From around 2007 to 2015 the number of races with 8 runners or more at turf and all weather tracks wasn’t dissimilar, but the period between 1995 and 2006, and the period between 2016 to now both showed a big difference.
What’s more, although the number of races with 8 or more runners has been improving since COVID, the gap between turf and all weather tracks remains, with a 12% average difference between 2020 and 2023.
It looks then as though all weather tracks are doing their bit to keep horse racing busy and interesting.