 Although they are annoying and disappointing to race goers and punters, non-runners are an unavoidable part of horse racing.
There are various legitimate reasons why a horse that had previously been entered into a race would have to be withdrawn, and most trainers operate within the spirit of the rules, but a small minority took advantage.
The British Horse Racing Authority (BHA) needs to keep the number of non-runners to a minimum in order to preserve the quality of the horse racing experience in this country, so it’s something they monitor closely and keep records of.
They keep records for each individual trainer too, not just for the industry as a whole, which enables them to spot patterns of behaviour or any worrying trends.
This is something they had to take action on in 2017 when they changed the rules around non-runners, and this has undoubtedly been beneficial to British racing.
As a punter though, you might be wondering how common non-runners are, because after all, they have an impact on your bets.
This article has the answers to your questions.
What is a Non-Runner and Why Does it Happen?

Let’s cover this very briefly just so everyone is on the same page here.
A non-runner is a horse that was entered into a race, but which doesn’t actually end up taking part. So their owner and trainer decided to race them, the horse’s name was added to the race card, but then the owner and trainer changed their minds for whatever reason, sometimes at fairly short notice.
In terms of bets, so long as the horse was officially declared and you weren’t betting ante post, your stake will be returned and the bet will be void. For accas the selection is simply removed and the odds adjusted accordingly.
If the horse become a non-runner at too short notice than rule 4 might come into effect, but we have a separate article on that here.
As for why a horse may be a non-runner, there are a few different reasons with the following being the most common:
- The going has changed making the race less suitable for the horse
- The horse did not travel well and is judged not to be in the right condition to race
- The horse didn’t make it in time due to unexpected travel delays
- The horse has become ill or sustained an injury
- The horse refused to enter the starting gate
That last one only applies to flat racing as there is no starting gate for national hunt racing.
More information may be required in some of these scenarios to justify the non-runner, so it’s not exactly a free for all, but the owners and trainers are ultimately allowed to decide what is best for their horse even if it means upsetting the punter.
There is an excellent article from Kubler Racing that goes into much more detail on this from the trainer’s point of view here. It really is worth a read.
How Often do Horses Become Non-Runners Each Year?
At first glance, the number of non-runners each year probably seems quite high, and it was becoming a bit of a problem for a while, especially when combined with increasingly smaller field sizes as we explored in this article.
For example, in 2022 there were 6,426 non-runners, and that sounds like an awful lot, but it actually makes up just 6.92% of the 92,821 runners who were entered into race for the year.
Another way of looking at it is to divide the total number by the number of days in a year:
- 6,426 ÷ 365 = 17.6
So you could say that, on average, there were 17.6 non-runners each day in 2022.
The number of non-runners is on a downward trend though, which is something the racing industry has been actively trying to achieve, but we will look at that aspect a little later in the article.
Going back to the 2022 data, we can see that you had around a 7% chance of your selection being declared a non-runner on average, but this figure is much improved from the 9.12% high of 2012.
The official records only go back to 2004, but this still gives us a good long range to dig into, and if you look at the table below, you can see how the overall percentage of non-runners started to get out of hand around the twenty tens:
| Year | # Non-Runners | % Non-Runners |
|---|---|---|
| 2022 | 6,426 of 92,821 | 6.92% |
| 2021 | 7,647 of 98,922 | 7.73% |
| 2020 | 5,820 of 79,692 | 7.3% |
| 2019 | 7,175 of 98,584 | 7.28% |
| 2018 | 6,791 of 99,816 | 6.8% |
| 2017 | 8,320 of 99,327 | 8.38% |
| 2016 | 8,393 of 98,010 | 8.56% |
| 2015 | 7,788 of 95,866 | 8.12% |
| 2014 | 8,214 of 95,746 | 8.58% |
| 2013 | 8,685 of 99,526 | 8.73% |
| 2012 | 9,054 of 99,242 | 9.12% |
| 2011 | 8,037 of 102,421 | 7.85% |
| 2010 | 8,414 of 100,440 | 8.38% |
| 2009 | 9,531 of 105,541 | 9.03% |
| 2008 | 8,683 of 106,724 | 8.14% |
| 2007 | 7,414 of 101,140 | 7.33% |
| 2006 | 6,601 of 101,225 | 6.52% |
| 2005 | 5,940 of 100,606 | 5.9% |
| 2004 | 5,348 of 98,118 | 5.45% |
We can ignore 2020 as that was the covid lockdown so it skews the data, but other than that, we can see that the number of horses running each year was somewhere between 95,000 and 105,000 most years.
Of course, 5% of 95,000 horses is less than 5% of 105,000 horses, so when talking about percentage increases or decreases in non-runners we need to be aware of this.
- 95,000 – 5% = 90,250 (4,750 non-runners)
- 105,000 – 5% = 99,750 (5,250 non-runners)
You can see that the same percentage taken off either end leaves a 500 horse difference in this example.
Nevertheless, studying the data in terms of percentages is the easiest way to digest it, and the difference isn’t earth moving, so this is what we will continue to do.
With that in mind, if we look at all of this data as one, and calculate the average percentage of non-runners per year from 2004 to 2022, that figure is 7.69%.
Are There More Non-Runners on the Flat or Over Jumps?
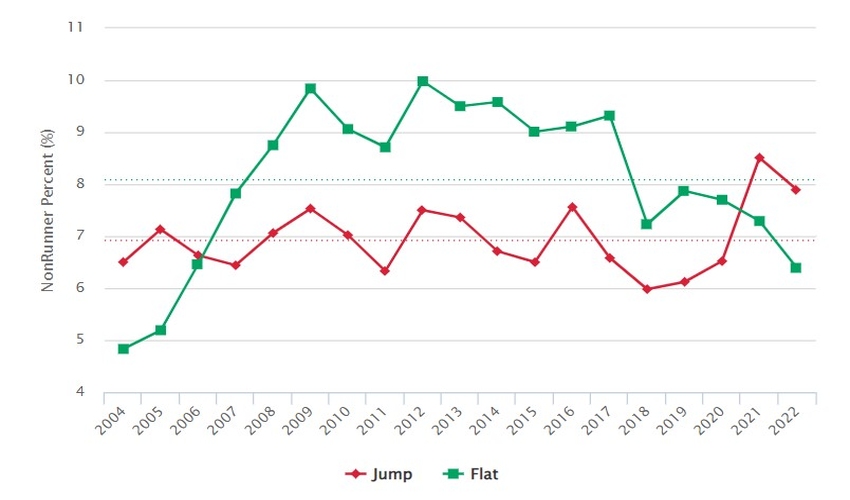
The data on each individual discipline is interesting, because although the number of non-runners tends to be far greater in flat racing overall, the number of non-runners within jump racing was higher in the early 2000s and again from 2021 onwards.
Have a look at the graph above taken from the British Horse Racing Association’s website, and you can see how that looks visually.
There are usually around twice as many flat runners each year than national hunt runners, so again, the actual number of non-running horses will be wildly different between the two forms of racing, but on percentage, flat racing saw more non-runners than jumps racing in 14 of the 19 years on record.
Here are the individual stats year by year:
| Year | Jump | Flat |
|---|---|---|
| 2022 | 7.89% | 6.39% |
| 2021 | 8.51% | 7.29% |
| 2020 | 6.52% | 7.7% |
| 2019 | 6.12% | 7.87% |
| 2018 | 5.98% | 7.23% |
| 2017 | 6.58% | 9.32% |
| 2016 | 7.56% | 9.11% |
| 2015 | 6.5% | 9.01% |
| 2014 | 6.71% | 9.58% |
| 2013 | 7.36% | 9.5% |
| 2012 | 7.5% | 9.98% |
| 2011 | 6.33% | 8.71% |
| 2010 | 7.02% | 9.06% |
| 2009 | 7.53% | 9.84% |
| 2008 | 7.06% | 8.75% |
| 2007 | 6.44% | 7.82% |
| 2006 | 6.63% | 6.46% |
| 2005 | 7.13% | 5.19% |
| 2004 | 6.5% | 4.83% |
Why has this crossover happened?
Well, jump racing non-runner rates have generally bobbed between around 6.5% and 7.5% since the records began in 2004, whereas flat racing non-runner rates have ranged from 4.83% at their lowest up to 9.98% at their highest.
So while jump racing rates have stayed fairly consistent over time with a 6.92% average, flat racing rates have moved quite a lot with an average of 8.08%.
The first crossover was between 2006 and 2007, when the number of non-runners in flat racing shot up and stayed up; but the crossover on the way back down only happened after 2020, although there was a dramatic fall in non-runners on the flat from 9.32% to 7.23% in 2017, after the new non-runner rules were introduced.
That’s a drop of 22% in a single year – the largest drop on record – so it would be hard to argue that the rule changes hadn’t had an impact on the number of non-runners in flat racing.
It’s true that non-runners in jump racing hit their highest ever peak in 2021, at 8.51%, but it reduced to 7.89% the year after in 2022, still the second highest number of non-runners, but we had some of the hottest weather in recent history during those years, so perhaps that explains it.
What has Been Done to Reduce the Number of Non-Runners?
![]() As mentioned earlier, the problem of non-runners was addressed by the BHA, and in 2017, various measures were tabled to reduce the number of horses being entered into races but then withdrawn.
As mentioned earlier, the problem of non-runners was addressed by the BHA, and in 2017, various measures were tabled to reduce the number of horses being entered into races but then withdrawn.
The chief purpose was to punish repeat offenders, and one of the ways put forward was to create a quarterly league table of trainers and record their rate of non-runners.
This would establish an average across the board, and any trainer with more than 100 declarations who went 50% above that average for a period of time would no longer be allowed self-certify for 12 months.
Self-certification only came in at the start of the 2008 racing season, allowing trainers to withdraw a horse from a race without a veterinary certificate and without penalty, but this was being abused by a small minority of trainers.
This move resulted in 13 flat trainers being suspended from self-certifying in 2018, and the BHA now keeps a regularly updated table of the worst offenders.
It was also decided that horses withdrawn due to the going would be monitored, and if they were raced on identical going within a certain time frame the stewards would hold an enquiry.
Basically, this would dissuade trainers from simply using the going as an excuse to pull their horse from the race, and any trainer who was inconsistent with their reasoning would have to explain further and potentially be fined.
Fines of £140 were already handed out to trainers who breached the rules of declaring non-runners, but these fines were to be increased on top of the rule changes.
It was also decided that owners of non-runners declared after 9am on the race day would still have to pay the jockey their fee, creating a further expense.
There were other measures brought in too, but all were done with the aim of bringing the number of non-runners down to a minimum, while still allowing trainers to withdraw horses for legitimate reasons without punishment.
It was a case of getting the balance right, and judging by the down trend in non-runner statistics, it looks like it worked pretty well.