 Put simply, the lower the bookmaker’s margin, the better value you are getting as a punter. It’s just the same as when buying goods and services; the smaller the profit margin taken by the shop/tradesman, the better value you get as the customer.
However, a bookmaker is a business just like a supermarket, and the margin is their profit, so if they take it too low they will not make enough money to run their business and will have to close.
On the flip side, take the margin too high and the bookmaker will no longer be competitive, their punters will bet with someone else and they will lose business, so it’s a constant balancing act whereby the bookie tries to offer strong odds while still earning enough to keep the lights on.
Various factors can impact the margin the bookmaker builds into their markets, and although we are looking at horse racing in this article, the same is true for all other sports.
As punters of course, we aren’t interested in the bookmaker’s balance sheet, we are only interested in winning our bets and being successful over the long term, and to do that, we need to find value bets.
The only way we know if a bet holds any value or not, is by working out the margin and seeing if we think the bookie has got things wrong.
But how has the bookmakers margin on horse racing changed over the years, and why has it gone up and down in the way that it has? We dig into the British Horse Racing Authority (BHA) records to find out.
A Brief Lesson on Bookie Margins
It will help to have a basic understanding of overrounds and margins before we delve into all of this, so although we have a more in-depth article on bookmaker’s margins here, let’s just go through it briefly on this page too.
To make a profit, a bookmaker needs to offer odds that are a little under the true chances of an event occurring. They do this on both sides of the bet (or on every horse), so you are never getting the true odds when betting with a fixed odds bookmaker.
You can think of the margin as the price the bookmaker charges for offering the service in the first place.
The coin toss is the typical example used to explain this sort of thing simply. A coin toss has a 50/50 chance of landing heads or tails, so the true odds should be 1/1 in fractional odds, or 2.0 in decimal odds.
A bookmaker couldn’t offer you these odds because even if their book was perfectly balanced (same number of bets for heads as for tails) they wouldn’t make any money after the toss was done.
Instead, they would offer something like 10/11 or 1.95. This doesn’t fairly reflect the chances of heads or tails, but it works in a margin for the bookie to make a small profit for offering the bet in the first place.
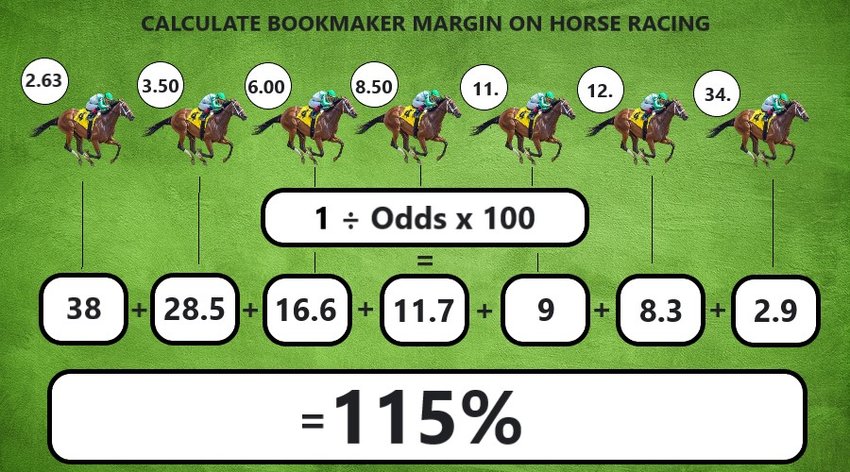
To work out the margin on a horse race, you need to do a few calculations for each horse.
You take their odds (turn them into decimals if they are not already), divide 1 by the decimal odds then multiply the answer by 100. Lastly, we add all the totals together.
If we use the following imaginary race as an example:
| Horse | Odds |
|---|---|
| Pepe Shelf Stackings | 2.63 |
| Flibbity Gibbet | 3.50 |
| Yo Momma | 6.00 |
| Whythelongface | 8.50 |
| Johnny Bagel | 11.00 |
| Whoopsie | 12.00 |
| ShouldaPulledaCart | 34.00 |
You can see the odds available for each horse, so now we have to do the following:
- 1 ÷ 2.63 x 100 = 38
- 1 ÷ 3.50 x 100 = 28.5
- 1 ÷ 6.00 x 100 = 16.6
- 1 ÷ 8.50 x 100 = 11.7
- 1 ÷ 11.00 x 100 = 9
- 1 ÷ 12.00 x 100 = 8.3
- 1 ÷ 34.00 x 100 = 2.9
Now we add all of those final values in bold together, which comes to 115, so the overround on that race is 115%.
Anything over 100% is the bookmaker’s margin, so in this case, the margin on the race is 15%.
Going back to the coin toss example then, with odds of 1.95 for heads and 1.95 for tails, we would end up with an overround of 102.4%, and therefore a margin of 2.44%, once we had applied the same maths to both sides of the bet.
Bookmaker Margins on Horse Racing
Now that’s all as clear as horse muck, we can start looking at some official stats.
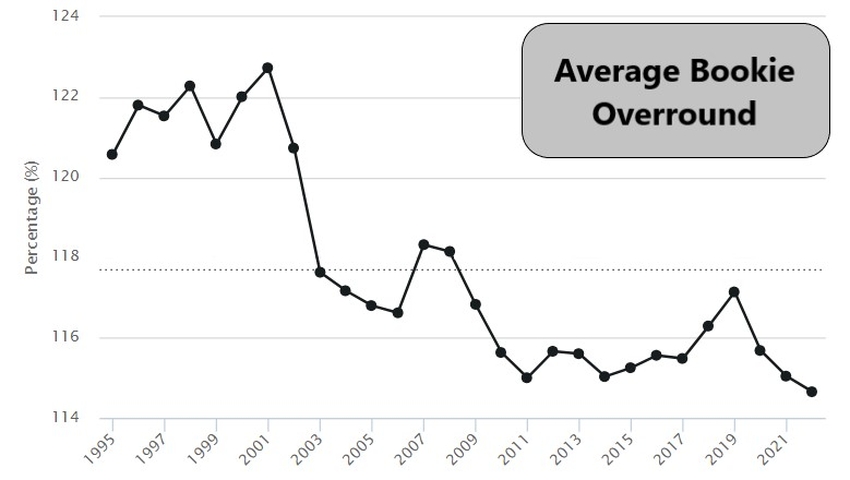
The data set provided by the BHA goes back to 1995, so we have almost 30 years-worth of stats to look at here.
From 1995 to 2022, the average overround on horse racing across all bookies was 117.71%, giving us a margin of 17.71%.
This figure has very broad parameters though, and things have changed an awful lot since 1995, so we need to dig deeper into the stats to see what has happened over time, and perhaps try to marry it up with what has been going on in the horse racing and gambling worlds.
1995 pre-dates internet betting for a start, and that must have changed things, and the industry became more competitive as well as having regulatory and tax changes to contend with.
It might shock you to find out that the worst year for punters was 2001, when the average margin across all races was 22.73%.
Although the highest since records began, at the time, it was only slightly more than normal. In fact, between 1995 and 2002 the lowest the average ever dropped to was 20.57%.
Here is the full table showing the average overround each year from 1995 to 2022:
| Year | Av Overround |
|---|---|
| 2022 | 114.65% |
| 2021 | 115.04% |
| 2020 | 115.68% |
| 2019 | 117.14% |
| 2018 | 116.29% |
| 2017 | 115.48% |
| 2016 | 115.56% |
| 2015 | 115.25% |
| 2014 | 115.03% |
| 2013 | 115.6% |
| 2012 | 115.66% |
| 2011 | 115% |
| 2010 | 115.63% |
| 2009 | 116.83% |
| 2008 | 118.15% |
| 2007 | 118.32% |
| 2006 | 116.62% |
| 2005 | 116.8% |
| 2004 | 117.17% |
| 2003 | 117.63% |
| 2002 | 120.73% |
| 2001 | 122.73% |
| 2000 | 122.01% |
| 1999 | 120.83% |
| 1998 | 122.28% |
| 1997 | 121.53% |
| 1996 | 121.8% |
| 1995 | 120.57% |
As you can see, the average trend is very much downwards.
This means that bookmakers are offering better value odds now than they were 30 years ago, and by a fair margin too (that pun was very much intentional).
In fact, margins were lower in 2022 than they had ever been, coming down some 8.08% from their peak in 2001.
So why is this happening; are bookmakers just feeling more charitable? Highly unlikely.
Why are Margins on Horse Racing Coming Down?

You might think that all the law changes around horse racing and betting in general would have pushed margins up, in order for the bookies to cover these extra costs.
After all, they have to pay 10% of gross profits on horse racing to the Horse Racing Betting Levy; the nation’s tax laws on gambling as a whole changed to a point of consumption tax in 2014 meaning they couldn’t save as much money by being based offshore; and this amount then went up from 15% to 21% in 2019.
Well, if you look at the total overround in the corresponding years to these changes there is a bit of a spike, so it looks like the bookies did have a go at clawing back some of these extra costs through slightly higher margins, but they always came down again.
This simply must be down to the level of competition within the betting industry.
Punters aren’t stupid, anyone who bets often knows that finding value bets is the key to long term success, and even those who bet infrequently can figure out how to shop around for better odds.
The rise of online betting created a swathe of new online betting websites, all wanting the steal a slice of the pie for themselves, and therefore having to find ways to stay competitive and attract punters.
This began in the early 2000s when telephone betting was also a big thing, just after the betting laws changed for the first time in decades in 2001, which also happens to be the year when margins were at their highest. Probably not a coincidence.
![]() Between 2002 and 2003 the average margin on horse racing dropped like a stone from 20.73% to 17.63%, the biggest downwards movement in a single year on record. This also happens to be when Betfair’s betting exchange became a big deal so bookies had that to deal with, on top of online betting in general growing at pace.
Between 2002 and 2003 the average margin on horse racing dropped like a stone from 20.73% to 17.63%, the biggest downwards movement in a single year on record. This also happens to be when Betfair’s betting exchange became a big deal so bookies had that to deal with, on top of online betting in general growing at pace.
The economic climate also played its part in bringing the bookmaker’s average margins down on horse racing though.
There was a spike in average margins in 2007, but the following year the country went into recession, bringing margins right back down again.
The bookies were creeping margins back up steadily between 2017 and 2019, going from 15.48% to 17.14% in 3 years, but what happened in 2020? Covid. And so back down came the bookies margin and it kept coming down as we entered a cost-of-living crisis.
Essentially, the bookmakers will try and increase their margins where they can get away with it, but they need people to bet to make money, so in many ways, the direction of their margins represents the direction of the country at that point in time.
Are Bookmaker Margins Higher for Jumps or Flat Racing?

The difference in average margin or overround between jump and flat racing can be surprising.
The gap was widest in 1997, when the average overround on jump racing was 118.69% for an 18.69% margin, compared with a 123.8% overround for a 23.8% margin on the flat – a difference of 5.11%.
This gap has closed a great deal since the early 2000s however, with little more than 2% between the two disciplines in many of the more recent years.
We showed you a table for the total bookmakers overround on horse racing in the section above, and here is that same information, but split between jump and flat racing:
| Year | Jump | Flat |
|---|---|---|
| 2022 | 113.39% | 115.43% |
| 2021 | 114.9% | 115.12% |
| 2020 | 116.01% | 115.5% |
| 2019 | 116.57% | 117.47% |
| 2018 | 115.56% | 116.72% |
| 2017 | 114.67% | 115.97% |
| 2016 | 114.93% | 115.94% |
| 2015 | 114.37% | 115.78% |
| 2014 | 113.98% | 115.65% |
| 2013 | 115.11% | 115.89% |
| 2012 | 114.78% | 116.16% |
| 2011 | 114.37% | 115.4% |
| 2010 | 115.22% | 115.85% |
| 2009 | 116.22% | 117.15% |
| 2008 | 117.84% | 118.32% |
| 2007 | 117.45% | 118.81% |
| 2006 | 115.9% | 117.05% |
| 2005 | 115.4% | 117.67% |
| 2004 | 115.53% | 118.21% |
| 2003 | 116.02% | 118.74% |
| 2002 | 118.45% | 122.29% |
| 2001 | 120.65% | 124.01% |
| 2000 | 119.02% | 124.12% |
| 1999 | 118.12% | 122.81% |
| 1998 | 120.14% | 123.89% |
| 1997 | 118.69% | 123.8% |
| 1996 | 120.54% | 122.75% |
| 1995 | 118.48% | 122.06% |
In all but 1 of the years between 1995 and 2022, the margin on flat racing was higher than the margin on jump racing, and which year were things the other way around?
It was 2020. Covid year. So it’s not really a reliable reflection of the way bookies are pricing their books and should probably be ignored.
For clarity then, flat racing carries a higher margin than jump racing on average every time.
The reason behind this is probably because there are typically more runners in a flat race than a jump race, and bookies tend to aim for around a 2% margin per runner as a rough guide.
In the example race we looked at towards the start of this article, there were 7 runners and the margin was 15%.
- 7 x 2% = 14%
Pretty close.
We changed the names of the horses but the odds were from a real race, which goes to emphasise this point. Alright, so the margin here was a little more, working out around 2.14% per horse, but it’s never going to be bang on.
It stands to reason then that a race with more runners will have a higher overround and margin than a race with fewer runners, which will push the average up over a large number of races and cause the disparity between jumps and flat races.
The average field size for jump races in 2022 was 7.73 compared with 8.9 on the flat, therefore, the margin is bound to be higher for flat races than jumps.