 Horse racing is one of the nation’s favourite sports, and despite going through difficult times there is still an awful lot of sporting action packed into such a small island.
Racecourses have been popping up for centuries now in regions up and down Great Britain, and although many of them have closed down over the years, there have been one or two new ones popping up as well, and those that are still with us run very regular meetings.
Still, if you are a racing fan then which region you live will have a profound impact on how often you can enjoy the sport live.
For some keen racegoers, it’s simply a matter of deciding which local track to visit and then jumping in the car for 20 minutes to get to either one of them; for racing enthusiasts who perhaps live in regions where there is no racecourse for miles around, it’s a much more expensive and time heavy excursion.
We decided to examine which region had the most horse racing, not just in terms of the number of racecourses, but in terms of their share of the number of races run each year too.
In some ways, it’s a pretty even split, but in others, it’s hardly fair at all.
Horse Racing in Britain: Region by Region
 The British Horse Racing Authority (BHA) keep data on the amount of racing that goes on in each region, but their regions are very broad.
It’s North, South and Midlands and that’s it. This is the whole of Great Britain too (so doesn’t include Northern Ireland), so what one person might consider the North might be classed as the midlands by the BHA.
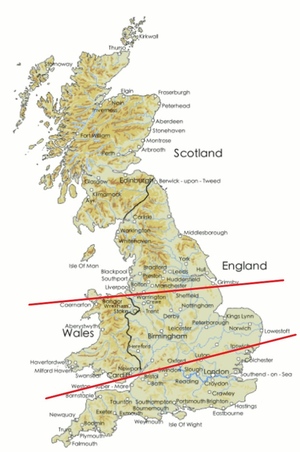
Where they draw the line between ‘regions’ isn’t exactly clear, but by looking at a few of the racecourses in one region that are close in proximity to courses in another, we can make a pretty confident guess.
The image on the right shows the sort of boundary they work to regarding horse racing regions, and as you can see, the North only just includes the likes of Doncaster Racecourse, then stretches all the way up to the most Northern point in Scotland.
In terms of land mass then it may not be a ‘fair’ way to divide the countries horse racing regions, but in terms of the number of racecourses and their density in different parts of the country, it does a pretty good job; Perth is the most northerly lying racecourse in Great Britain, and it’s roughly only at the midpoint of Scotland.
This is slightly problematic depending on how you look at things, but still, it gives us a good indication of where racing happens in the country.
| North | Midlands | South |
|---|---|---|
| Ayr | Banger-on-Dee | Ascot |
| Aintree | Cheltenham | Bath |
| Beverley | Chester | Brighton |
| Carlisle | Fakenham | Chelmsford City |
| Cartmel | Great Yarmouth | Chepstow |
| Catterick Bridge | Hereford | Exeter |
| Doncaster | Huntingdon | Epsom Downs |
| Musselburgh | Leicester | Fontwell Park |
| Hamilton Park | Ludlow | Ffos Las |
| Haydock Park | Market Rasen | Goodwood |
| Hexham | Newmarket | Kempton Park |
| Kelso | Nottingham | Lingfield |
| Newcastle | Southwell | Newbury |
| Perth | Stratford-upon-Avon | Newton Abbot |
| Pontefract | Uttoxeter | Plumpton |
| Redcar | Warwick | Salsbury |
| Ripon | Wolverhampton | Sandown Park |
| Sedgefield | Worcester | Taunton |
| Thirsk | – | Wincanton |
| Wetherby | – | Windsor |
| York | – | – |
This table shows us that there are 21 racecourses in the North, 20 racecourses in the South, and 18 racecourses in the Midlands.
That’s a pretty even spread by those boundaries, and if we look at the percentage of British racing that takes place in each of those regions year on year, we can actually see that, while the numbers shift around a bit in terms of which region has the most racing, the overall numbers are higher today than they were back in the 1990s.
Here is the annual percentage of racing that took place in each region along with the number of races run in Britain in total:
| Year | North | Midlands | South | # Races Total |
|---|---|---|---|---|
| 2022 | 31.93% | 31.65% | 36.14% | 1,447 |
| 2021 | 31.32% | 30.97% | 37.65% | 1,437 |
| 2020 | 30.78% | 31.47% | 37.27% | 1,017 |
| 2019 | 30.12% | 30.89% | 38.64% | 1,444 |
| 2018 | 30.5% | 31.45% | 37.91% | 1,472 |
| 2017 | 31.13% | 31.26% | 37.61% | 1,465 |
| 2016 | 30.68% | 30.47% | 38.49% | 1,434 |
| 2015 | 28.82% | 31.39% | 39.65% | 1,440 |
| 2014 | 28.83% | 33.59% | 37.44% | 1,429 |
| 2013 | 27.69% | 33.92% | 38.25% | 1,430 |
| 2012 | 26.48% | 34.16% | 38.7% | 1,367 |
| 2011 | 27.16% | 34.45% | 38.05% | 1,469 |
| 2010 | 26.58% | 34.34% | 38.72% | 1,329 |
| 2009 | 26.37% | 34.57% | 38.5% | 1,426 |
| 2008 | 25.37% | 34.01% | 40.13% | 1,423 |
| 2007 | 26.24% | 35.26% | 37.44% | 1,330 |
| 2006 | 25.78% | 37.93% | 35.54% | 1,342 |
| 2005 | 29.54% | 37.46% | 32.62% | 1,300 |
| 2004 | 29.18% | 35.33% | 35.33% | 1,299 |
| 2003 | 31.39% | 34.43% | 34.02% | 1,220 |
| 2002 | 30.22% | 35.49% | 33.59% | 1,158 |
| 2001 | 29.48% | 35.02% | 34.74% | 1,065 |
| 2000 | 29.86% | 35.6% | 33.75% | 1,132 |
| 1999 | 30.23% | 34.58% | 34.75% | 1,151 |
| 1998 | 30.87% | 33.77% | 34.56% | 1,137 |
| 1997 | 30.59% | 35.18% | 33.8% | 1,154 |
| 1996 | 30.75% | 34.14% | 34.31% | 1,122 |
| 1995 | 30.82% | 34.55% | 33.91% | 1,100 |
So we ran more than 300 races more in 2022 than we did back in the 1990s, and while the North has gradually increased its racing activity (very gradually) to a steady 30%-31% of the action, racing in the Midlands has dropped back a bit since its’ peak of 37.93% in 2006, and the South took over as the busiest region for racing from 2007 onwards, reaching a high of 40.13% in 2008.
The closure of Folkestone racecourse in 2012 would have had some impact on the figures in the Southern region, but more than offset by the addition of Ffos Las in 2009 and Chelmsford City in 2008, while the closure of Towcester in 2019 would have had a more marked impact in the Midlands.
Mostly though, this change will be to do with how many meetings are being held at individual racecourses in those regions and how many races are on the race card.
It’s all well and good saying that, based on these statistics, whatever ‘region’ you live in you are just as well served for horse racing as any other, more or less; but in reality that’s not the case.
If you live in Inverness, or Anglesey, or Penzance, then you’ve got a chunky journey ahead of you if you want to visit the racetrack.
Best UK County for Horse Racecourses
Have a look at this image showing the approximate locations of every one of the 59 racecourses in Great Britain.
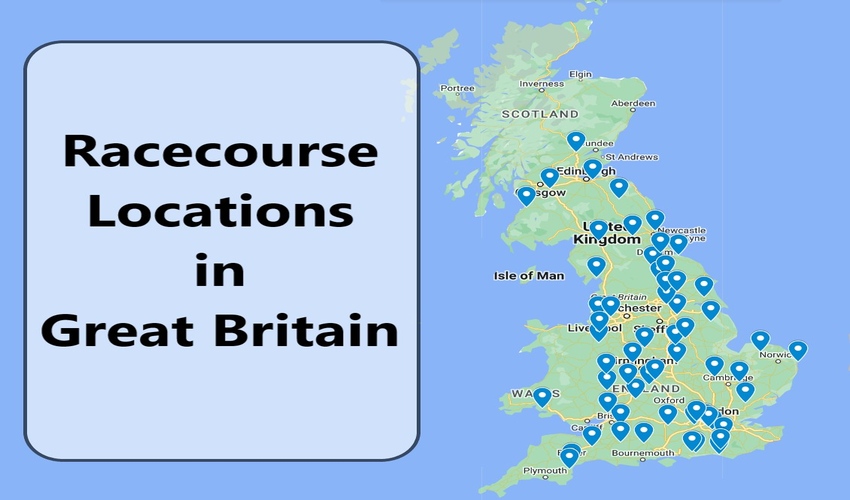
You will notice that actually, they seem pretty well spread out.
Sure, if you go to the extremities like Inverness and the place mentioned above, then you’re going to be fairly far from a racecourse, but even in the worst served areas, the farthest you will be from live racing is about 2.5 hours in a car, and maybe even quicker by train (we aren’t going to check all the train timetables to find this info out, soz).
It is perhaps fitting, that the largest county in the country, North Yorkshire, has the greatest number of racecourses at 5, while Surrey is close behind with 4 racecourses, and Berkshire and Somerset have 3 racecourses apiece.
Here are how the other counties hold up:
| # Racecourses | Counties |
|---|---|
| 5 | North Yorkshire |
| 4 | Surrey |
| 3 | Berkshire; Somerset |
| 2 | Cumbria; Devon; East Sussex; Merseyside; Norfolk; Nottinghamshire; Warwickshire; West Sussex; West Yorkshire |
| 1 | Ayrshire; Cambridgeshire; Cheshire; Clwyd; County Durham; Dyfed; East Lothian; East Riding of Yorkshire; Essex; Gloucestershire; Gwent; Herefordshire; Lanarkshire; Leicestershire; Lincolnshire; Northumberland; Perth and Kinross; Roxburgh, Ettrick and Lauderdale; Shropshire; South Yorkshire; Staffordshire; Suffolk; Tyne and Wear; West Midlands; Wiltshire; Worcestershire |
That’s just 39 counties which have a racecourse.
Some of those with only one have huge populations too, such as Essex with more than 3 million people, while others counties with huge populations like Lancashire at 5 million people don’t have any racecourses at all.
However, the populations of these places can fairly easily access nearby racecourses, such as those in Merseyside or West Yorkshire for Lancastrians, as an example.
The people of North Yorkshire undoubtedly have it best though, with 5 racecourses to split between around 1 million people.