 If you see an odds on favourite, you know it has a very strong chance of winning the race, so if you are going to bet against it you better have found some pretty compelling evidence in your research as to why you think it won’t win.
Of course, finding great value odds elsewhere, or betting without, or a strategic each way wager or something like that may also be a part of your decision, but the shorter the odds of the favourite, the more risk you are taking.
This would make horse racing a boring sport to watch if it happened too often, as it would lose the ability to surprise us, but luckily that isn’t the case.
Not only are odds on favourites rarer than you might imagine, but of course, even when a favourite is priced odds on, it doesn’t always go on to win.
This keeps horse racing fresh and lively and interesting for us punters, but the frequency of odds on favourites is worth keeping an eye on because it could be an early warning sign of things becoming stale.
As for how often odds on favourites occur, I have that information for you in plenty of detail below.
What Does Odds On Favourite Mean?
I know this will be common knowledge to most of you reading this, but just in case anyone has come across this article who does not know what an odds on favourite is, let’s cover it now.
Skip ahead if you are already familiar with the term.
So a favourite is quite obviously the horse that is judged most likely to win the race, but the favourite can change as the odds shorten and lengthen in the lead up to a race. This happens as punters place bets and push the odds in different directions as bookies try to balance their books – but essentially, the whole market is responsible for deciding the favourite, not just the bookies.
When the odds are first set by the bookmakers though, the favourite is established as the horse with the shortest odds.
The exact odds a horse is given will depend on the other horses in the field; so if it is a strong field there might be 2 or 3 different horses that could all realistically stand a high chance of winning.
Odds that everyone will understand are evens, or 1:1 if you are more familiar with a casino style format – so if you bet £10 and are correct, you get £10 back on top of your stake.
This is often referred to as ‘even money’, and means the market thinks there is a 50% chance of the horse winning.
Quite simply then, ‘odds on’ means a horse that has greater than 50% chance of winning, and odds against means a horse that has less than a 50% chance of winning.
How can a favourite have less than a 50% chance of winning?
Well they might still be the favourite (the horse with the shortest odds), but due to the strength of their competition they can be determined as being more likely to lose than win.
Say a horse in a race with 8 runners has a 35% chance of winning (odds of 13/7), and the others have a 25% chance (3/1), a 15% chance (17/3), a 10% chance (9/1), two with a 5% chance (19/1), a 3% chance (32/1) and a 2% chance (49/1); cumulatively, all of the other horses have a better chance of winning than the favourite, so even though that horse has the shortest odds of all of the runners individually, the odds are still against it winning. Thus, it is an odds against favourite.
This is common, and horse racing wouldn’t be as enjoyable to watch if that were not the case as it would be far more predictable – if anything it shows the sport is still highly competitive.
Anyway, flip that around, and you can easily understand what odds on means – a horse who is deemed to have a better chance of winning the race than all of the other horses combined.
How Common is an Odds on Favourite?
So now we come to the heart of the matter.
Odds on favourites aren’t as common as you might think; the figures surprised me because every time I go to make a bet it seems like the odds are only just worth taking, but maybe that says more about my betting and researching skills than anything else.
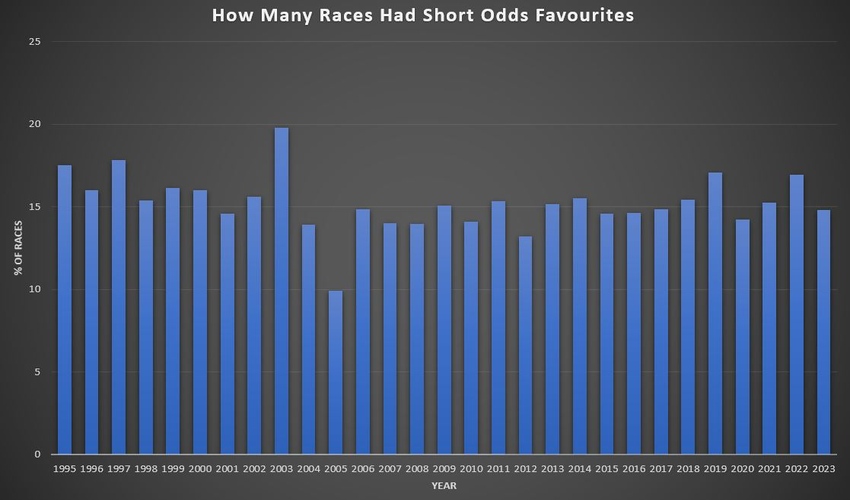
What’s more, the percentage of odds on favourites has remained fairly consistent over a long period of time, with only a brief anomaly in the early 2000s.
Those few years aside, the figure has remained between 13% and 18%.
Here is the total number of odds on favourites for each year from 1995-2023:
| Year | Total Races | # Odds On Favs | Total % |
|---|---|---|---|
| 2023 | 9,998 | 1,480 | 14.8% |
| 2022 | 10,216 | 1,730 | 16.93% |
| 2021 | 10,353 | 1,581 | 15.27% |
| 2020 | 7,882 | 1,122 | 14.23% |
| 2019 | 10,086 | 1,722 | 17.07% |
| 2018 | 10,406 | 1,606 | 15.43% |
| 2017 | 10,288 | 1,527 | 14.84% |
| 2016 | 10,035 | 1,470 | 14.65% |
| 2015 | 10,041 | 1,466 | 14.6% |
| 2014 | 10,105 | 1,569 | 15.53% |
| 2013 | 10,146 | 1,538 | 15.16% |
| 2012 | 9,647 | 1,276 | 13.23% |
| 2011 | 10,147 | 1,557 | 15.34% |
| 2010 | 9,566 | 1,347 | 14.08% |
| 2009 | 9,628 | 1,451 | 15.07% |
| 2008 | 9,494 | 1,324 | 13.95% |
| 2007 | 8,877 | 1,245 | 14.03% |
| 2006 | 8,934 | 1,326 | 14.84% |
| 2005 | 8,588 | 851 | 9.91% |
| 2004 | 8,577 | 1,192 | 13.9% |
| 2003 | 8,028 | 1,589 | 19.79% |
| 2002 | 7,691 | 1,199 | 15.59% |
| 2001 | 7,141 | 1,043 | 14.61% |
| 2000 | 7,422 | 1,189 | 16.02% |
| 1999 | 7,528 | 1,215 | 16.14% |
| 1998 | 7,387 | 1,137 | 15.39% |
| 1997 | 7,460 | 1,331 | 17.84% |
| 1996 | 7,278 | 1,165 | 16.01% |
| 1995 | 7,124 | 1,249 | 17.53% |
That blip from 2003 to 2005 is interesting, but I can’t understand why it might have happened. Online betting was only just starting to take off around this time, but it wasn’t yet a real threat to traditional bookmakers, so I don’t think it was anything to do with competition in the market.
Even if that did have something to do with it, the market is what ultimately decides.
In all of this time, there has only been one instance where the number of odds on favourites increased or decreased more than 2 years in a row, and that was between 2016 and 2019 when the number went from 14.65% to 17.07% – a difference of just 2.42% over that time.
In almost any other subject pertaining to horse racing, whether it be the attendances at racecourses, the number of non-runners, or the average bookie margin, you can see big changes over the years or long running trends, but the number of odds on favourites has remained steady.
So while horse racing may be facing problems in many areas, the competitiveness of the races doesn’t appear to be one of them, because if it was I would expect to see the number of odds on favourites rising.
Odds on Favourites More Common in Jump Racing

The figures in the section above give us a good overview of the situation with odds on favourites in UK horse racing, but we can look a little deeper by comparing jumps and flat racing.
Since 1995, the average number of odds on favourites in jump races was 18.99%, compared to just 12.84% on the flat – that’s a difference of more than 6%.
You may well be wondering why this is, and the answer is actually quite straight forward.
Before we get into that though, let’s look at the numbers for jump racing and flat racing side by side:
| Year | Jump | Flat |
|---|---|---|
| 2023 | 17.75% | 13.11% |
| 2022 | 20.71% | 14.63% |
| 2021 | 18.32% | 13.49% |
| 2020 | 17.65% | 12.38% |
| 2019 | 20.39% | 15.12% |
| 2018 | 19.69% | 12.97% |
| 2017 | 20.24% | 11.56% |
| 2016 | 18.58% | 12.3% |
| 2015 | 17.79% | 12.67% |
| 2014 | 18.54% | 13.71% |
| 2013 | 17.79% | 13.62% |
| 2012 | 16.84% | 11.13% |
| 2011 | 19.01% | 13.08% |
| 2010 | 17.93% | 12.09% |
| 2009 | 18.64% | 13.14% |
| 2008 | 15.75% | 12.96% |
| 2007 | 18.43% | 11.52% |
| 2006 | 19.11% | 12.24% |
| 2005 | 12.47% | 8.32% |
| 2004 | 17.87% | 11.37% |
| 2003 | 25.28% | 16.03% |
| 2002 | 20.17% | 12.47% |
| 2001 | 18.07% | 12.49% |
| 2000 | 20.44% | 12.9% |
| 1999 | 20.46% | 12.98% |
| 1998 | 19.08% | 12.62% |
| 1997 | 22.64% | 14% |
| 1996 | 19.58% | 13.34% |
| 1995 | 21.95% | 14.37% |
Here there is a clear distinction between the two racing disciplines, with jumps seeing a far higher percentage of odds on favourites than flat racing in every year on record.
Not once has flat racing seen a higher percentage of odds on favourites than jump racing – but why?
Well, horses competing over obstacles tend to be older, more experienced animals than those on the flat.
This means they have a longer track record in the sport and therefore there is more information available on them; bookies and punters have had more time to get to know these horses and study their form over the years.
More information tends to mean more accurate predictions, and this shows up in the odds (odds tend to be shorter in jumps racing in general).
What’s more, jumps racing attracts smaller fields on average too. In fact, since around 2016, an average of 20.23% jump races have had fewer than 6 runners, compared to 12.20% of races on the flat.
Fewer runners means shorter odds, it has to, because there are not as many competitors taking their share of the chance of winning.